Customising a mock survey
In this example, we demonstrate how to put in a custom survey specification in terms of frequency range and sky area.
[1]:
import numpy as np
from meer21cm import Specification, MockSimulation
from meer21cm.util import create_wcs_with_range
from meer21cm.plot import plot_map
from meer21cm.util import redshift_to_freq
import meer21cm
import matplotlib.pyplot as plt
from astropy.wcs import WCS
data_dir = meer21cm.__file__.rsplit("/", 1)[0] + "/data/"
Default
By default, if you create a default Specfication (which is also the base class for everything else such as PowerSpectrum or MockSimulation), the specs follow the MeerKLASS L-band deep survey:
[2]:
sp = Specification(
    survey='meerklass_2021',
    band='L',
)
[5]:
sp.z_ch.min(),sp.z_ch.max(),sp.freq_resol
[5]:
(np.float64(0.38764963174851164),
 np.float64(0.4626012258024983),
 np.float64(208984.375))
[6]:
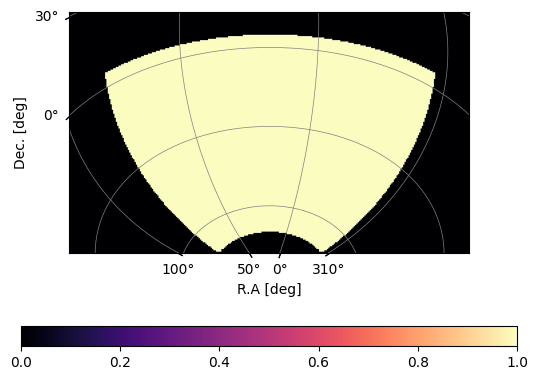
plot_map(sp.W_HI,sp.wproj)

Note that, the area specified by wproj is typically larger than the actual area as a buffer. For example, if you put in the actual survey range for MeerKLASS L-band, meer21cm will recognise and create a survey selection function automatically. For praticatical purposes, the edge of the wproj area is always set to False as shown above. If you put in a specific range:
[8]:
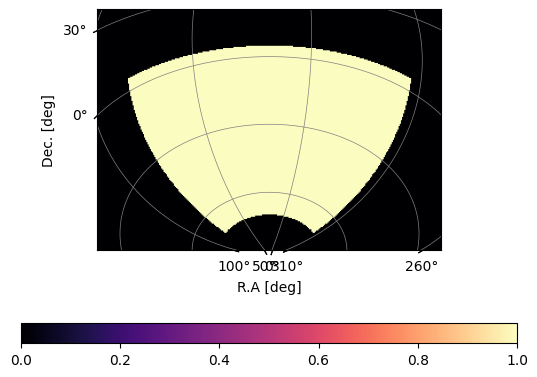
raminMK,ramaxMK = 334,357
decminMK,decmaxMK = -35,-26.5
ra_range = (raminMK,ramaxMK)
dec_range = (decminMK,decmaxMK)
sp = Specification(
    survey='meerklass_2021',
    band='L',
    ra_range=ra_range,
    dec_range=dec_range,
)
[9]:
plot_map(sp.W_HI,sp.wproj)
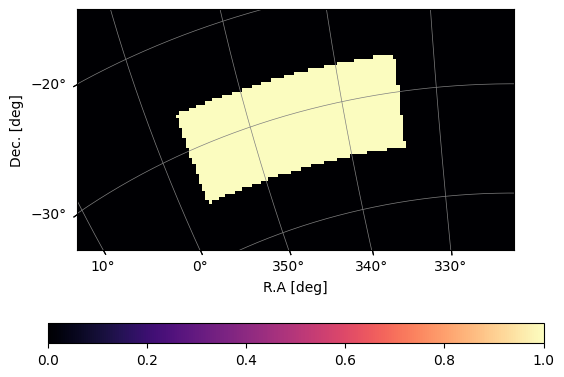
You can see that the selection function is automatically updated.
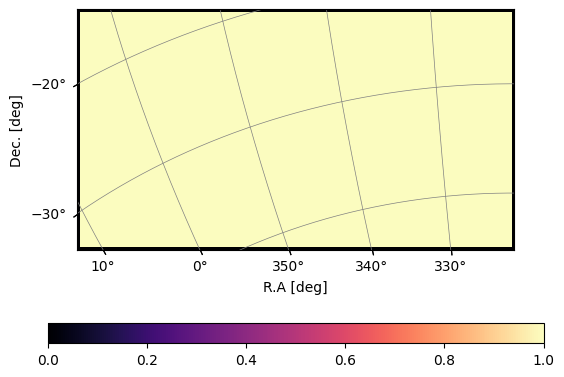
Custom redshift bin
Customising the redshift range is easy by simply setting custom frequency channels. Note that however, meer21cm does not support equally spaced redshift channeles, and assumes that frequency channels are equally spaced. This should be the case for any radio survey.
Suppose you want approximately z=0.5-1.0, with a frequency resolution of 1MHz:
[10]:
z_min = 0.5
z_max = 1.0
freq_resol = 1e6
num_ch = int((redshift_to_freq(z_min)-redshift_to_freq(z_max))/freq_resol)
nu = np.linspace(0,num_ch-1,num_ch) * freq_resol + redshift_to_freq(z_max)
[12]:
sp = Specification(
    nu = nu,
    wproj = sp.wproj,
    num_pix_x = sp.num_pix_x,
    num_pix_y = sp.num_pix_y,
)
[14]:
sp.z_ch.min(),sp.z_ch.max(),sp.freq_resol
[14]:
(np.float64(0.5027522535193767), np.float64(1.0), np.float64(1000000.0))
The area will still be the default:
[15]:
plot_map(sp.W_HI,sp.wproj)
Custom survey area
Custom survey area is a little bit more complicated. meer21cm uses astropy.wcs.WCS for mapping the pixels to the sky coordinates. It relies on two ingredients: the wcs for projection, and (num_pix_x, num_pix_y) for array dimensions.
If you already have an actual data stored in a fits file, the best way to do this is to extract from that:
[16]:
map_file = data_dir + "test_fits.fits"
wcs = WCS(map_file)
# extract the 2D array dimensions
num_pix_x,num_pix_y, _= wcs.array_shape
# you need to drop the axes that are not angular
wproj = wcs.dropaxis(-1)
[17]:
sp = Specification(
    wproj=wproj,
    num_pix_x=num_pix_x,
    num_pix_y=num_pix_y,
)
[18]:
plot_map(sp.W_HI,sp.wproj)

If you are starting from scratch, you can use create_wcs_with_range. It needs ra_range, dec_range, angular resolution, and coordinate type as input (see documentation for more details). Let’s say we are making a roughly 20x20 deg^2 area with 0.5 deg resolution:
[19]:
ramincustom,ramaxcustom = -10,10
decmincustom,decmaxcustom = -10,10
ra_range = (ramincustom,ramaxcustom)
dec_range = (decmincustom,decmaxcustom)
ang_resol = 0.5
wproj,num_pix_x,num_pix_y = create_wcs_with_range(
    ra_range,
    dec_range,
    resol=[ang_resol,ang_resol],
)

sp = Specification(
    wproj=wproj,
    num_pix_x=num_pix_x,
    num_pix_y=num_pix_y,
    ra_range=ra_range,
    dec_range=dec_range,
)
[20]:
plot_map(sp.W_HI,sp.wproj)
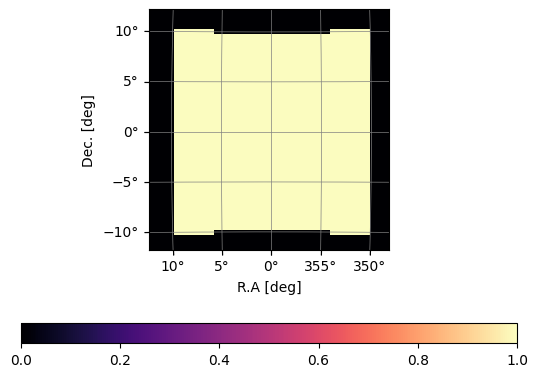
The wcs always leave a bit more empty space as buffer. Note that, in some extreme cases, the default buffer [1.2,1.2] may not be enough to cover the range:
[21]:
# note that (315,80) is different from (80,315)
ramincustom,ramaxcustom = 315,80
decmincustom,decmaxcustom = -70,5
ra_range = (ramincustom,ramaxcustom)
dec_range = (decmincustom,decmaxcustom)
ang_resol = 0.5
wproj,num_pix_x,num_pix_y = create_wcs_with_range(
    ra_range,
    dec_range,
    resol=[ang_resol,ang_resol],
)

sp = Specification(
    wproj=wproj,
    num_pix_x=num_pix_x,
    num_pix_y=num_pix_y,
    ra_range=ra_range,
    dec_range=dec_range,
)
plot_map(sp.W_HI,sp.wproj)
You should therefore always examine this and change if needed:
[22]:
wproj,num_pix_x,num_pix_y = create_wcs_with_range(
    ra_range,
    dec_range,
    resol=[ang_resol,ang_resol],
    buffer=[1.2,1.4],
)

sp = Specification(
    wproj=wproj,
    num_pix_x=num_pix_x,
    num_pix_y=num_pix_y,
    ra_range=ra_range,
    dec_range=dec_range,
)
plot_map(sp.W_HI,sp.wproj)
An example to generate a mock observation with custom specs:
[23]:
ramincustom,ramaxcustom = -10,10
decmincustom,decmaxcustom = -10,10
ra_range = (ramincustom,ramaxcustom)
dec_range = (decmincustom,decmaxcustom)
ang_resol = 0.5
wproj,num_pix_x,num_pix_y = create_wcs_with_range(
    ra_range,
    dec_range,
    resol=[ang_resol,ang_resol],
)

mock = MockSimulation(
    nu=nu,
    wproj=wproj,
    num_pix_x=num_pix_x,
    num_pix_y=num_pix_y,
    ra_range=ra_range,
    dec_range=dec_range,
    tracer_bias_1=1.5,
    tracer_bias_2=1.5,
    num_discrete_source=10000,
    mean_amp_1='average_hi_temp',
    downres_factor_radial = 2.0,
    downres_factor_transverse = 2.0,
    box_buffkick = 30.0,

)
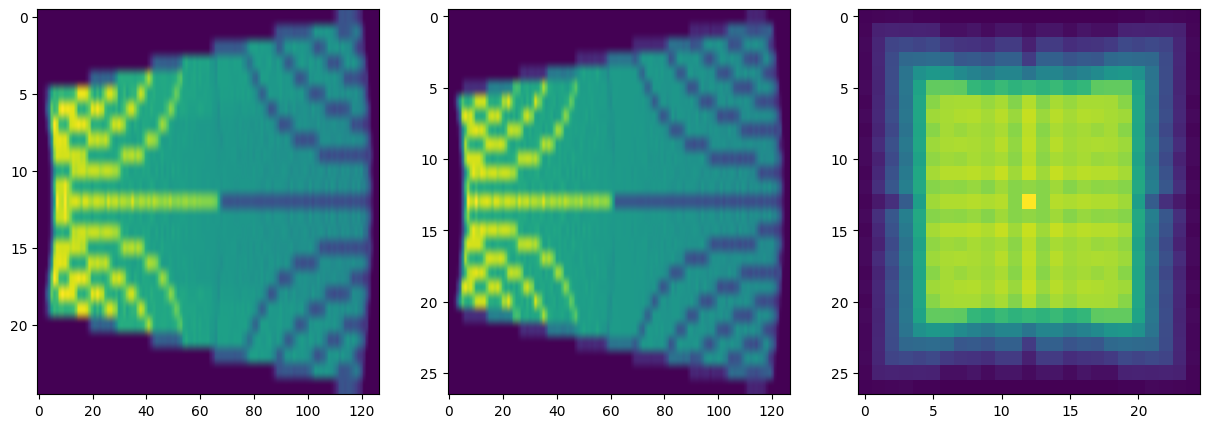
Let us check the survey lightcone:
[24]:
mock.get_enclosing_box()
[ ]:
mock.grid_data_to_field();
[31]:
fig,axes = plt.subplots(1,3,figsize=(15,5))
for i,ax in enumerate(axes):
    ax.imshow(mock.counts_in_box.mean(i),aspect='auto')